Geopolitical escalation pressures Gold, but the reaction is…
The current week in the financial markets has entered a new concerning phase. What began on Wednesday, July 8, as a single-day flare-up in the US–Iran conflict has evolved into a second consecutive night of military exchanges across the Persian Gulf — with larger-scale strikes, broader regional retaliation and sharp reaction in the markets.
What happened: The US launched a fresh wave of airstrikes against approximately 90 Iranian targets, while Iran responded by targeting US military positions in Bahrain, Kuwait and Qatar. Oil surged nearly 5% on Wednesday and continued higher overnight. Gold fell to a one-week low near $4,056. Treasury yields held near 4.57% on the 10-year. Risk appetite has still not turned back.
The impact on oil
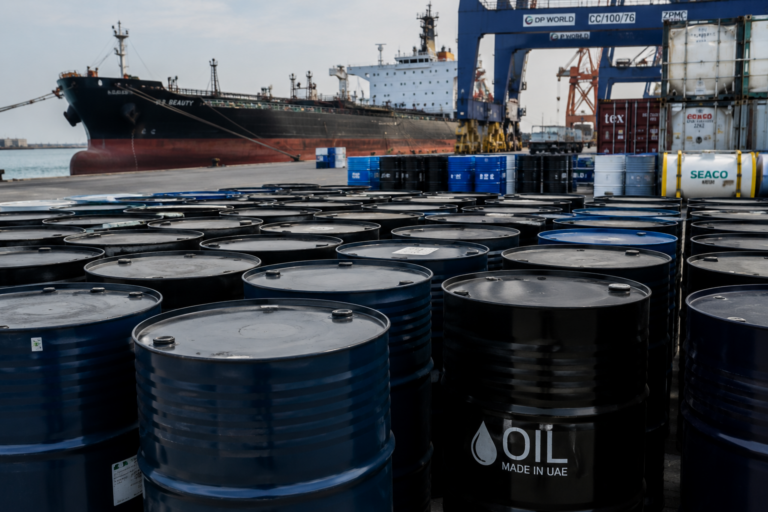
Markets seemingly are no longer pricing a one-day response — they are pricing the increased escalation cycle, as Crude oil has sharply reversed. Brent crude settled nearly 5% higher on Wednesday, reaching approximately $78 per barrel. WTI gapped above $75 in the NYMEX night session. By Thursday’s Asian session, Brent was pressing toward $79. US Strategic Petroleum Reserve stocks remain at their lowest level since 1983.
Trump declared the ceasefire “over”, warned attacks “could get much worse”, and renewed threats about Kharg Island — which handles roughly 90% of Iran’s crude exports. He also acknowledged Iran had called and wanted a deal, though he questioned whether Tehran could honour one.
WTI Crude (USOIL) — two-day escalation cycle, July 8–9, 2026. Source: Exness.comGold gets under pressure
Gold (XAU/USD) fell to $4,056–4,066 per ounce — the lowest since July 1. Bank of America cut its 2026 average gold forecast by 14% to $4,360, as the Fed is expected to get more hawkish this year. Higher oil, a stronger dollar and rising real yields provide pressure for metals.
XAU/USD — weekly low near $4,056, July 9, 2026. Source: Exness.comFed minutes confirm division — hawkish tilt reinforced overnight
The FOMC June minutes revealed a deeply divided Committee. A few officials saw a case for raising rates in June. CME FedWatchtool currently shows a 50% probability of interest rate hike in September: this number has lowered after a weaker than anticipated NFP report, but after cancellation of the ceasefire between the US and Iran from president Donald Trump, the hawkish expectations have returned.
Probabilities of different interest rates scenarios, July 9, 2026. Source: https://www.cmegroup.com/markets/interest-rates/cme-fedwatch-tool.htmlRisk appetite has still not turned back
European stocks dropped, Gold and Oil have stabilized displaying a range-bound activity. VIX keeps near lows, while fear-and-greed index stays in the neutral zone.
News in focus for the week: 13-17 July, 2026
- Tuesday, July 14, 12-30 GMT: US CPI (June 2026) — key inflation publication.
- Tuesday, July 14, 14-00 GMT: Fed Chair Warsh Testimony
- Wednesday, July 15, US PPI, 12-30 GMT (June 2026)
- Friday, July 17, 14-00 GMT Michigan consumer sentiment index.
Now let’s turn to potential scenarios and trading ideas for the week ahead.
WTI Crude oil (USOIL)
USOIL may retrace back to 200-day moving average and stabilize around $76 price level as a part of regular mean-reversion activity. The escalation in the Middle East had boosted the price of Crude oil higher, and whether or not escalation would continue or not, Crude oil has a chance of getting back to its 200-day moving average (the $76 level) and above.
USOIL, daily chart. Source: Exness.comXAUUSD
Gold had trimmed the decline having found support at $4040 price area despite the sharp pullback of crude oil and rising yields of 30-year bonds from the US. It reacts neutrally now to any external triggers. There’s a seasonal tendency of potential growth for Gold starting from mid July, and this may skew the probability of upward direction ahead of next week’s US CPI report, which may become a trigger for the move. Until then, the price may consolidate inside of the triangle as shown on the chart below
XAUUSD, Daily chart. Source: Exness.com